Comparing Specific Heat of Water and Vegetable Oil
Experiment number : 1770
Goal of experiment
The goal of this experiment is to compare specific heat capacities of sunflower oil and water.
Theory
Heat capacity is a physical quantity that determines the heat supplied to (resp. removed from) the body that causes heating (cooling) of the body by 1 K. It is denoted c and is defined as:
\[C\,=\,\frac{Q}{\Delta t}\tag{1}\]where Q is the heat that was supplied to (removed from) the body and Δt is the temperature difference caused by supplying (removing) the heat. Heat capacity is a property of a particular subject. If the body is homogeneous, it can be written as:
\[ C\,=\,c\cdot m\tag{2}\]where m is the mass of the body and c is the specific heat capacity of the substance from which the body is made.
Specific heat capacity determines the heat supplied to (removed from) the body that causes heating (cooling) of 1 kg of substance by 1 K; it is not a characteristic of a particular subject, but the material itself. Using the specific heat capacity, the heat supplied (removed) can be enumerated by combining equations (1) and (2) as follows:
\[ Q\,=\,c\cdot m \cdot\Delta t \tag{3}\]The specific heat capacity expresses a “willingness” of a substance to change its temperature – the lower the value, the more easily the temperature changes.
Note: In the case of solids, an important role in the temperature increase is played also by thermal conductivity of the material. In this experiment, we will measure liquids, where the heat exchanges by convection and the influence of thermal conductivity is negligible.
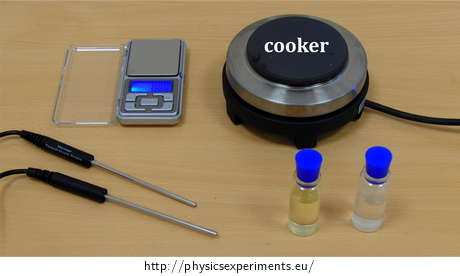
Tools (Fig. 1)
Two identical containers, water (c ≐ 4200 J·kg-1·K-1), oil, balance, heat source (burner, cooker, etc.), two temperature sensors cooperating with the computer; laboratory stand (if necessary).

In the sample experiment we used cooking sunflower oil (c ≐ 2250 J·kg-1·K-1) and two Vernier TMP-BTA temperature sensors.
Procedure
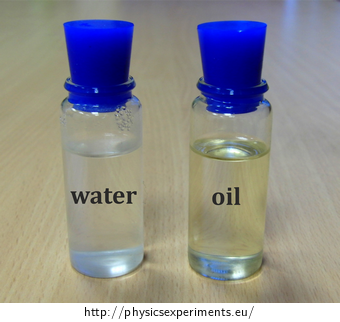
Fill one of the two identical containers with water and the second with oil of the same mass. The density of the oil is lower; therefore the oil has larger volume. (Fig. 2).

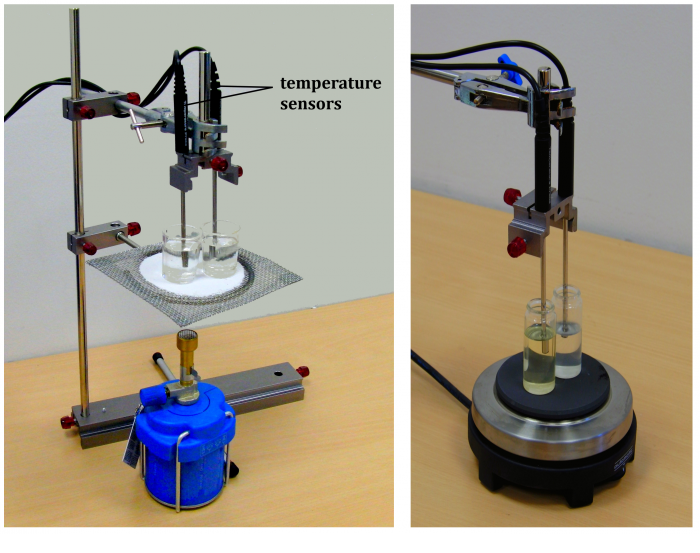
Place the containers above a burner or on a cooker so that they are both supplied with the same amount of heat, i.e. symmetrically around the flame of the burner or in the middle of the cooker plate.
Insert the temperature sensors in both containers. The arrangement of the experiment in different variations is shown in Figure 3.
Start the measurement and begin to heat both liquids. Observe the graph plotted by the computer.
Once one of the measured temperatures exceeds 80 °C, turn off the heat source and stop the measurement.
Sample result
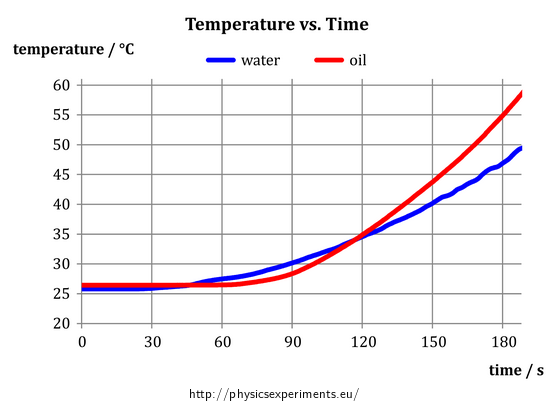
After the measurement, we obtain the following graph of the temperature of oil and water vs. time:

Specific heat capacity describes a “willingness” of the substance to change its temperature – the higher the specific heat capacity is, the less “willing” the substance is to change its temperature. Because the oil warmed more than the water, its specific heat capacity is lower compared to water.
Detailed interpretation of graph in Sample result
As mentioned above, the graph in Fig. 4 gives us information that the oil is heated more than water during the measurement. Its specific heat capacity is therefore smaller. At first glance, it is obvious that if we ended the measurements for example at 90 seconds, we would obtain opposite result – at this time, water has a higher temperature. How to explain this strange contradiction?
If we repeat the experiment, we come to the conclusion that it is not a random measurement error – at the beginning of each measurement, the water begins to heat up more quickly and later on is “caught up” by the oil; clearly, this is a manifestation of a certain physical law.
The answer lies in the mechanism of heat exchange in liquids, which is mainly by convection. While water with low viscosity flows relatively easily, oil with a much larger viscosity circulates more slowly. Therefore, if we heat the bottom of the container, it takes a relatively long time before the heated oil rises from the bottom to the temperature sensor, which registers the temperature increase. For water, this process is significantly faster, therefore the temperature of water always starts to increase first and then it is followed by the (steeper) temperature increase of oil.
The above explanation can be experimentally demonstrated by submerging the temperature sensors to the bottom of the containers. In such an arrangement, the effect of different flow on the measured temperature fades out and oil heats up faster.
The explanation of the above stated phenomenon and proposing its experimental demonstration can serve as an interesting problem task for students.
Technical notes
The temperature sensors should not touch the walls and bottoms of the containers. It is recommended to place the sensors at the same height above the bottom.
It necessary to avoid that one container is closer to the heat source than the other – we need to ensure a uniform heating of both containers.
If we do not have temperature sensors that can be connected to a computer, we can use e.g. liquid thermometers and write down the temperatures every ten seconds.
Throughout the measurement it is necessary to be careful when working with the burner of the cooker!
If you work with a cooker, you need to realize that even after you turn it off, the plate is still hot and the temperature of the liquids still rises (in the case of oil it can exceed 100 °C)!
Be careful when disposing hot water and oil in the containers. Never pour the hot oil into the waste! It is recommended to hand it over to Waste Disposal Service. In view of school practice it is also possible to let the oil cool down and store it for later use in lessons.
Pedagogical notes
If we tell the students the values of specific heat capacities before the measurement, we can ask them to construct a hypothesis about the result, or to draw a graph of temperature vs. time for both liquids.
It is also recommended to ensure that both liquids are of the same temperature before the measurement. This can be obtained by preparing both oil and water in the classroom an hour before the experiment.
We can inform the inquisitive students that specific heat capacity is slightly dependent on temperature – like the majority of other physical constants from all parts of physics.
The dynamic viscosity of a substance also depends on temperature. However, in this case the influence of temperature is more essential than it was in the previous case – for example when heating water from 0 °C to 100 °C, its dynamic viscosity decreases to less than one fifth of its original value. Also the dynamic viscosity of oil decreases quickly during the experiment.
List of table values
The specific heat capacity and viscosity of vegetal oils (among which our sunflower oil can be found) is described in the article Viscosity and specific heat of vegetable oils as a function of temperature: 35 °C to 180 °C.
A very extensive database of specific heat capacities is listed on the web page The Engineering ToolBox.


