Dependence of Evaporation Rate of Liquid on Liquid Surface Area
Experiment number : 1774
Goal of experiment
The following experiment describes the measurement of the dependence of evaporation rate of a liquid on its surface area.
Theory
The evaporation rate does not have an accustomed definition or denotation in physics. Logically it seems reasonable to define it as the mass of liquid evaporated per unit of time. For students it is easier to say that it is the mass change in various containers per the same period of time; therefore, we will not attempt to say an intuitive definition.
Tools
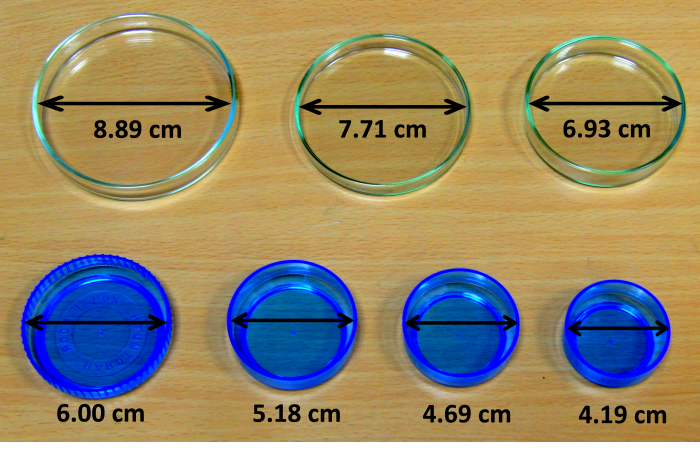
Scales (with a sensitivity of at least 0.01 g), industrial alcohol, containers with different diameters (the more expensive version is Petri dishes, the cheaper version is for example a tray for mixing colours in art, in our exemplary case we used both – see Fig. 1), calliper to measure the diameter of the containers.
Procedure
Measure the diameter of the containers with a calliper and write it down.
Pour the industrial alcohol into all of the containers (it does not have to be the same amount of alcohol) and weigh them.
Then let the alcohol evaporate and after at least one hour measure the mass of the containers again. The mass difference represents the mass of the evaporated alcohol in each container.
Sample result
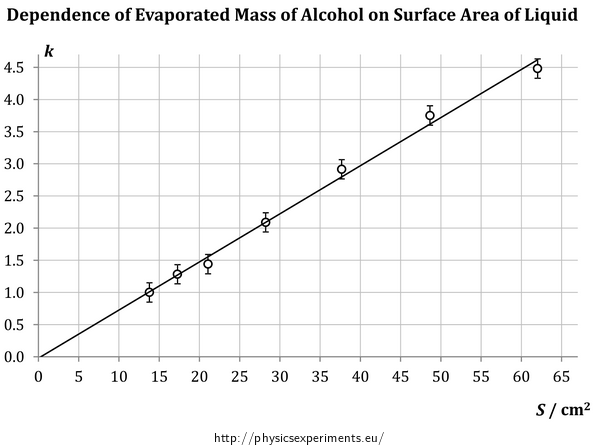
The measurement was performed ten times, but each time lasted for a different amount of time. Therefore, it is not possible to determine the average mass of the evaporated alcohol – shorter measurements mean that the amount of evaporated alcohol is, of course, lower. Therefore, for the purpose of data processing, a new dimensionless coefficient \(k\) was introduced, which shows how many times is the mass of evaporated alcohol in each measurement bigger than the mass evaporated from the smallest container (For example, \(k\) = 2 for a given container says that the mass of alcohol evaporated from this container is two times bigger than the mass evaporated from the smallest container per the same amount of time). In such data processing procedure no longer depends on the time of the measurement and it is possible to determine the average value of \(k\). Of course a teacher should consider whether to tell this to their students or to do with a less accurate but vivid measurement.
Values measured in this experiment are shown in Table 1 and graph in Fig. 2. The graph shows that with increasing surface area, the mass of evaporated alcohol increases (through the coefficient \(k\)) linearly and linear extrapolation to zero surface areas suggests even a direct proportion.
Table 1:
S (cm2) 13.8 17.3 21.1 28.2 37.7 48.6 62.0 k 1.00 1.28 1.44 2.09 2.91 3.75 4.48 
Technical notes
Due to the alcohol vapour it is not comfortable to perform this experiment in the classroom where a lesson is in progress. It is recommended to place the containers in another classroom.
This experiment is successful only when using shallow containers. When you use a high container, the evaporating alcohol condensates on the walls of the container and the mass decreases more slowly.
After pouring alcohol into the containers, it is good to check whether there is no alcohol on the outside walls of the container. Otherwise there is a risk that the fast evaporation of alcohol from the outside walls of the container affects the measurement.
It is recommended to place the containers in the same space – this prevents the risk, that the containers are at places with different temperature or different air circulation, which affects the rate of evaporation.
Pedagogical notes
With its length, this measurement is suitable to be performed during two consecutive physics lessons. It requires to be handled by the experimenter only at the beginning and end of the measurement; it is therefore natural to fill the time of the measurement by a different activity (lecture, practising, experiment…)
The measurement is time consuming; therefore it is not possible to repeat it during the lesson. If you want to have more measured values, however, you can let more groups of students conduct this measurement simultaneously. You only need to equip each group with the same set of containers. The weighing is conducted at the beginning and the end, one scale therefore suffices.
The measurement of the diameter of the containers can be an independent laboratory task; it includes handling a calliper and statistically processing the measured data obtained by repeatedly conducted measurement of the same variable.


