Dependence of Evaporation Rate of Liquid on Removing Fumes from above Its Surface
Experiment number : 1948
Goal of experiment
The goal of the experiment is to quantitatively demonstrate the effect that removing fumes from above the surface of a liquid has to the speed of its evaporation.
Theory
Tools
Scales (sensitive to at least 0.01 g), technical ethanol, Petri dish, computer ventilator (typically running at 12 V), source of 12 V AC (adjustable if possible), voltmeter/multimeter.
Procedure
We turn on the scales, fill the Petri dish with ethanol and place it on the scales.
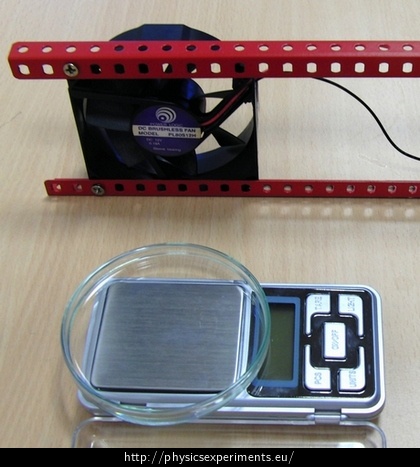
We connect the ventilator to the AC source and place it 5 to 10 cm from the dish so that after we turn it on the air stream is directed above the ethanol surface (see Fig. 1).
We write down the initial mass \(m_1\) shown by the scales and turn on the ventilator with a suitable input voltage (which we can control with a voltmeter).
After 5 minutes we disconnect the ventilator and write down the final mass \(m_2\); we are interested in the loss of mass \({\Delta}m\,=\,m_1\,–\,m_2\).
We repeat the experiment with different input voltages.
Sample result
We can measure the loss of mass \({\Delta}m\) for different input voltages and show without any difficult data processing that with increasing voltage increases not only the spinning frequency of the ventilator, but also mass of ethanol evaporated in the same time interval (e.g. 5 minutes). It is also helpful to add to the comparison what the mass loss is without using the ventilator.
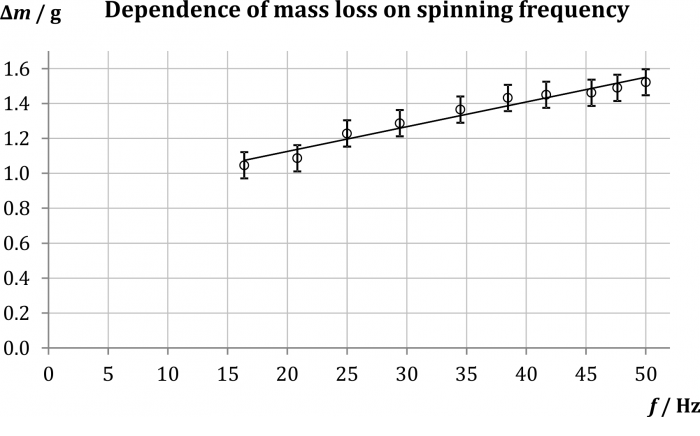
In our sample measurement the loss of mass in 5 minutes was measured for ten values of input voltage between 3 and 12 V. Then we took the processing one step further – using the optical gate Vernier Photogate, for each of the ten values of voltage the spinning frequency of the ventilator was measured (see table 1). This allowed us to create a graph of the mass loss \({\Delta}m\) in relation to the spinning frequency of the ventilator, as is depicted in Fig. 2. It is obviously an increasing dependency which shows signs of linearity; however, real effects of turbulent flow on evaporation are so complex that the linear approximation shown in the graph needs to be taken with discretion.
Table 1:
\(U\,/\,\mathrm{V}\) 3.0 4.0 5.0 6.0 7.0 8.0 9.0 10.0 11.0 12.0 \(f\,/\,\mathrm{Hz}\) 16.4 20.8 25.0 29.4 34.5 38.5 41.7 45.5 47.6 50.0 \(\Delta m\,/\,\mathrm{g}\) 1.05 1.09 1.23 1.29 1.37 1.43 1.45 1.46 1.49 1.52 Technical notes
If the ventilator is turned on, the scales can at first glance show chaotic increases and decreases of mass depending on the immediate effect the turbulent flow has on the surface of ethanol.
Because of the point above, values of mass must be read at times when the ventilator is turned off.
Pedagogical notes
Measurement of the whole dependency, as shown in table 1, is time consuming and creates blank spots during the five-minute intervals. It may be more practical in a lesson to just demonstrate that when we remove fumes from above the surface, much more ethanol will evaporate, without any following mathematical data processing.


